

Insight | 12 : The Great Correlation Inversion
DECEMBER 2025
Aref Karim - Ershadul Haq - Raami Karim
THE GREAT CORRELATION INVERSION
WHEN EQUITIES AND BONDS MOVE TOGETHER
The Ripple Effect
In March 2020, almost everything sold off together. Two years later, in 2022, equities and bonds fell in tandem, overturning the core assumption behind traditional 60/40 portfolios. A relationship that had been reliably negative for two decades flipped positive in a matter of months. These were not anomalies. They were moments when the underlying correlation architecture — the wiring that binds global markets — briefly became visible.
Markets now behave as a tightly coupled network. A rate decision in Washington can reprice equities, bonds, commodities and credit across time zones before the press conference ends. The dollar doesn’t just move emerging markets; it simultaneously shifts credit risk, energy curves and rate expectations across every major financial centre.
For investors and market participants, understanding this architecture on how assets connect and when those connections tighten or break, is central to capital preservation. The old map no longer fits the terrain.
The Forces Behind Correlation
Correlations are not random. They are the footprint of a small number of forces acting across the system. Understanding them helps distinguish genuine diversification from the illusion of it.
1| The Denominator Effect
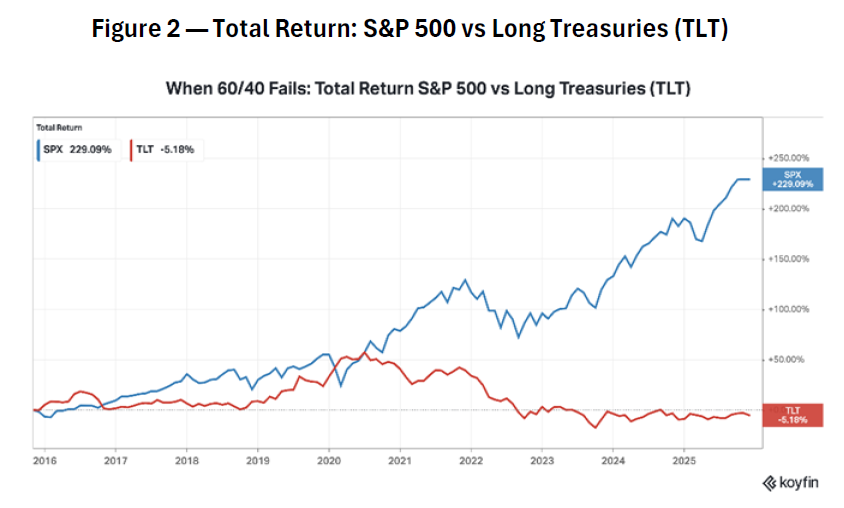
When interest rates are low and stable, assets can move on their own fundamentals. Investors differentiate between strong and weak companies, stable and fragile currencies. Correlations stay relatively low because cash flows are being discounted at similar, predictable rates.
When rates move sharply higher, the cost of capital becomes the dominant variable. The denominator in every discounted cash flow model rises together, compressing valuations across equities, bonds, real estate, growth and value at the same time. Duration risk overwhelms idiosyncratic stories. The correlation architecture ‘compresses’, and diversification based on historic relationships disappears precisely when it is most needed.
2| The Global Liquidity Tide
Central bank balance sheets form the hydraulic system of global finance. When major central banks inject liquidity, all boats rise. They lift valuations across most risk assets. When they drain liquidity through QT or tighter financial conditions, the tide goes out broadly and a lot fall together. Many assets that appear distinct share a sudden hidden dependency on abundant liquidity. The dependency was always there, just not obvious in a static correlation matrix until the tide turned.
3| Clustering of Algorithms
Modern market structure now creates its own correlations. Passive indexation, risk-parity, volatility-control and other systematic strategies trade in baskets, not stories. When a large volatility-control fund de-risks, it sells a sleeve of futures, not because fundamentals have changed, but because their model cut exposure. This produces ‘phantom correlations’: assets moving together because they sit in the same execution bucket, and not because they share genuine economic drivers. For systematic investors, separating fundamental from mechanically induced correlations is now essential.
The Great Inversion
For more than 20 years, portfolio construction rested on a simple premise: bonds hedge stocks. When growth slowed or recession fears rose, central banks cut rates, bonds rallied and equities struggled. The negative stock–bond correlation was the bedrock of 60/40.
That era has ended. We are now in a regime shaped less by deflationary growth scares and more by supply constraints, geopolitical fragmentation and persistent inflation pressure. In this regime, the stock–bond correlation does not just weaken; it inverts. Both respond to the same driver: the path of real rates and inflation expectations.
In 2022 this regime break became painfully obvious. Bonds sold off as yields rose in response to inflation; equities sold off as higher real rates compressed valuations and threatened growth. Both engines of the ‘balanced’ portfolio went into reverse at the same time. What looked diversified, a mix of long-only equity and bond funds, ETFs and credit was revealed as a single directional bet on real rates.
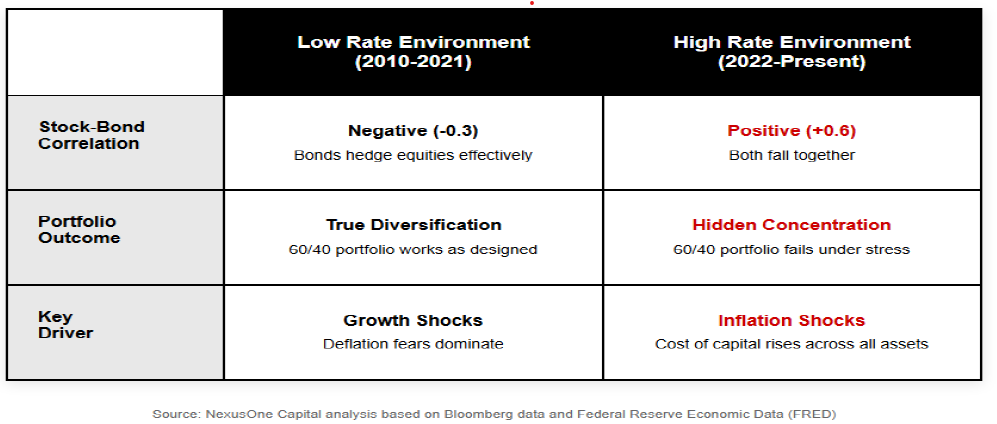
For most of the post-2016 period, long Treasuries (TLT) tended to diversify equities (SPY), with correlation often below zero. From 2022 onward that relationship flipped decisively positive as inflation and policy tightening became the dominant macro drivers. The correlation has eased from its peak, but it is still meaningfully positive, enough to blunt classic 60/40 protection when it matters.
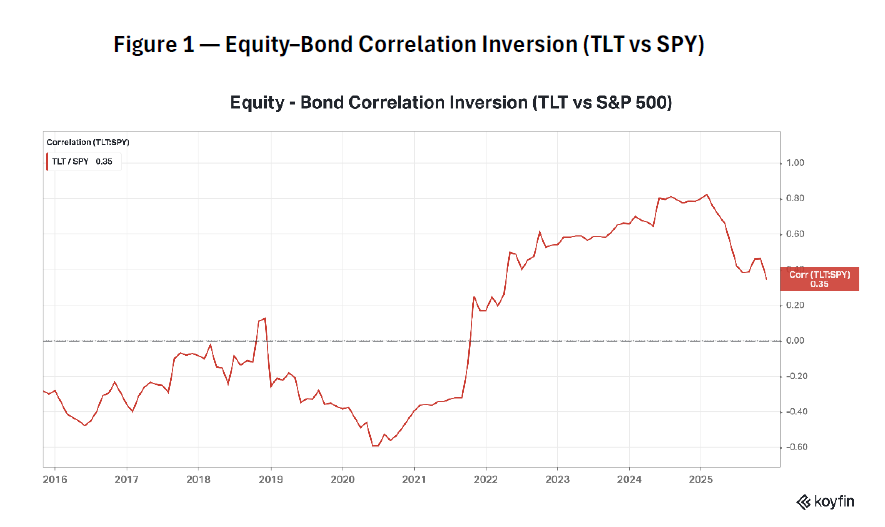
Over the last decade, the S&P 500 has delivered strong cumulative gains, while long-duration Treasuries have produced roughly flat to slightly negative total returns over 10 years, including a deep drawdown during the 2022 rates shock. The key point is not ‘bonds are bad’. It is that in an inflation-driven regime, bonds can lose value at the same time as equities, eroding the diversification investors typically assume. This is the realistic expression of the correlation inversion.
Put simply, when inflation and the policy response are the dominant forces, duration stops behaving like a hedge and starts behaving like another source of risk. That is why the correlation can flip — and why portfolios built on the assumption of a stable negative equity–bond correlation can experience deeper drawdowns than expected.
This is not a one-off. The inflationary regime of the 1970s showed that such correlation structures can persist for a decade or more. Recognising this break and the possibility that it can last years, not quarters, is step one in building portfolios that can withstand it.
Velocity of Changing Correlations
The second change is not just what correlations do, but how fast they move. In earlier cycles, a stress event in one market would spread gradually as investors processed information and repositioned. Today, we run in a regime of hyper-correlation. A sentiment shock in Asia is reflected in European and US futures before their cash markets open. When key levels break, algorithmic flows cascade across exchanges in milliseconds. There is no decision window for discretionary investors; the repricing is often well advanced before the narrative is fully formed.
In stress, correlations no longer drift toward 1.0 over weeks. They spike toward near-perfect correlation in minutes. Diversification vanishes precisely when it is most needed. Risk models calibrated on monthly or even daily correlations understate this dynamic. By the time those models notice the spike, much of the damage is already done.
Understanding Market Clusters
Since static diversification rules no longer work, we need a different lens, that which treats markets as a dynamic network of clusters. Today, two variables sit near the centre of that network: US real rates and the US dollar. Almost every major asset – gold, equities, investment-grade credit, developed FX – can be understood in terms of its distance from, and sensitivity to, those two anchors.
Around these nodes sit clusters. A financial cluster (global equity indices and credit) moves as a block with high sensitivity to liquidity and rates. A real-economy cluster (commodities, energy, industrial metals) is still influenced by macro conditions but constrained by physical supply and logistics.
The clearest signals for investors come when market connections change. Factors like political tensions, the shift to clean energy, and moving supply chains are breaking old links. Some commodities, such as European natural gas, now depend more on politics and weather than the global economy.
These structural decoupling create rare, genuine diversification opportunities: assets whose drivers really are different when the next shock hits. These create new challenges but also potential to profit from.
The Equity Resilience Paradox
Given the breakdown of stock–bond diversification and the speed of contagion, a natural question arises: why have headline equities been so strong?
From the October 2022 bear-market low, the S&P 500 has risen close to 90% in a little over three years. Major indices now sit near all-time highs. This apparent resilience is sometimes used as evidence that the system is robust. It reveals how narrow the current regime has become. Markets have priced a new secular growth driver: AI-enabled productivity. If AI allows earnings to grow faster without proportionally raising labour or capital costs, it offers a path to higher real growth with contained inflation. That story has been powerful enough to offset the drag from higher rates so far.
The resilience is also intensely concentrated. A small group of mega-cap technology companies—the ‘Magnificent Seven’—now accounts for roughly one-third of the S&P 500’s market capitalisation, up
from low-teens percentages a decade ago. Beneath the surface, equal-weight indices, small caps, much of Europe and many EM markets have delivered far weaker returns. For genuinely diversified investors, realised equity performance has looked very different from the headline S&P numbers.
Finally, real yields have stabilised. US 10-year real rates peaked in October 2023 at 2.55%, currently at 1.90%, following a low of 1.50% last year — and have since traded in a relatively held range. The pain comes during the repricing phase; once markets accept a new level for real rates, valuations can rebuild on that foundation—at least until the next shock.
The key insight: equity resilience since 2022 does not mean correlation architecture has stopped to matter. It means a small group of companies has temporarily escaped that architecture’s gravitational pull.
Looking Toward 2026
Looking into 2026, we see three broad scenarios capture the main market paths. Each scenario offers its own unique challenges and opportunities for investors to navigate.
1| Sustained Soft Landing AI-led productivity feeds through to earnings; growth stays positive while inflation trends lower. Central banks can gently reduce real rates. Stock–bond correlations drift back toward neutral or negative territory and equity leadership slowly broadens.
2| Inflation Resurges Supply constraints, geopolitics and demographics keep inflation sticky. Real rates must stay high or move higher. Stock–bond correlations remain positive and another rates shock hits both legs of 60/40 at once, putting renewed pressure on rate-sensitive assets.
3| Growth Shock Policy overtightening, a credit event or a geopolitical shock triggers recession. Bonds rally as central banks cut aggressively; equities and credit sell off. The classic negative stock–bond pattern reappears, but from a starting point where many investors are structurally underweight.
Reality may blend these regimes over time. What matters for portfolio construction is not betting on a single path but recognising which environment we are in and rotating risk accordingly.
NexusOne Insight | Turning Regimes into Opportunity
At QCM we run a Systematic Macro strategy that is widely diversified across signals as well as assets traded through liquid futures — macro, momentum, mean-reversion, relative value, convexity and volatility — across multiple timeframes. Different engines dominate under different correlation regimes. When traditional stock–bond diversification works, some components contribute more; when it inverts, others take the lead. Robustness comes from structural diversity in the building blocks, not from any single, static correlation pattern.
Through futures, we can adjust long/short exposure seamlessly as signals evolve. This helps the portfolio shift risk between equities, bonds, FX and commodities as regimes change, without relying on discretionary timing.
We cannot predict which of the broad paths for 2026 will dominate. What we can do is stay agnostic on the narrative and disciplined on the signals:
❖ Long/short exposure across equities, bonds, FX and commodities allows us to take part in both ‘risk-on’ and ‘risk-off’ regimes.
❖ A broad global opportunity set means correlation breaks and volatility spikes – are not just risks, but also potential openings for profit.
❖ A rules-based process helps us respond as regimes evolve, rather than trying to forecast every turn in advance.
The post-2022 landscape is very different from the decade that preceded it. Correlations have inverted, the speed of contagion has increased, and equity strength has become narrowly concentrated. For static 60/40 portfolios, that is a problem. For systematic strategies built to respond to regime change, it is also a source of opportunity.
We enter 2026 with a diversified, correlation-aware framework and no reliance on any single market outcome. Whatever mix of soft landing, renewed inflation or growth shock the next year delivers, our job is the same: to let the data guide positioning and to turn shifting market architecture into tradable positions, rather than unpleasant surprises.
© 2025 QCM Ltd. All rights reserved. For informational purposes only. Not investment advice or an offer to invest.